Introduction
e2o_downscaling tools consists of a number of Python based meteorological scripts focussing on downscaling the meteorological forcing of the eartH2Observe project. The scripts can:
- retrieve all meteorological variables that are part of the eartH2Observe WRR1 and WRR2 datasets for a region of interest on a user defined grid extent and resolution;
- downscale the meteorological variables temperature and air pressure using a DEM based elevation correction;
- calculate potential evaporation from the WRR1 and WRR2 datasets using the Penman-Moneith, Priestley-Taylor or Hargreaves equation, optionally considering elevation corrections for temperature, air pressure and radiation and shading corrections for radiation.
The current functionality is implemented in three scripts that all output daily values:
- e2o_radiation.py - Make clear sky radiation maps and inclination correction maks for optional use by the e2o_calculateEvaporation.py script
- e2o_getvar.py - Download and resample variables from the meteorological forcing datasets (V1 and V2). This script resamples and extracts the data and can optionally downscale precipitation and temperature.
- e2o_calculateEvaporation.py - Calculate reference evaporation from the meteorological forcing dataset (three available methods) using elevation based downscaling optionally combined with radiation downscaling using the output of the e2o_radiation script. The script can also output downscaled versions of all variables used to calculate the evaporation.
The only input the user needs to supply is a high-resolution regular DEM in GEOTiff format of the area he/she is interested in. Reference evaporation will be calculated from the eartH2Observe dataset. This dataset provides a version V0 (WRR1) and V1 (WRR2). WRR1 is based on the WFDEI dataset that is corrected following the method developed in the EU FP6 project WATCH. In this method ERA-interim re-analysis data is corrected with the observation based CRU dataset (Weedon et al., 2014). The dataset covers the period 1979-2012 and contains the following 3-hourly gridded data fields: Air temperature, rainfall rate, air pressure at surface, longwave downward radiation, shortwave downward radiation, air humidity and wind speed. Daily values are derived by calculating the daily average of the 3-hourly values. WRR2 covers 1979 to 2014 and here the precipitation and snowfall come from MSWEP (Beck. et. all 2016) while the other variables are derived from Era Interim with a number of corrections applied.
Determining downscaled reference evapotranspiration from the forcing dataset
The tools assume you have a digital elevation model for your area. This file should be in a GDAL supported format (preferably GTiff).
- Optionally, first run the e2o_radiation script. This will generate Clear-Sky radiation maps for each day of the year (four maps per day). These maps can be used by the e2o_calculateEvaporation script to downscale reference ET
- Next run the e2o_calculateEvaporation script. This will calculate downscaled ET based on a local DEM for the period you specify in the .ini file
Note
See the documentation per module for more information.
The figure below shows the steps used to generate down-scaled reference evaporation in the scripts.
![digraph steps {
"Clear sky radiation maps" [shape=box];
"Reference evaporation" [shape=box];
"e2o_radiation.py" -> "Clear sky radiation maps" [label =" Correct for aspect and slope with DEM"];
"e2o_calculateEvaporation.py" -> "Reference evaporation" [label =" Downscale using DEM and clear-sky maps"]
"Clear sky radiation maps" -> "e2o_calculateEvaporation.py"
dpi=69;
}](_images/graphviz-666b50ce05cfcd580ae9e404321d80f6745a49f7.png)
This document is a technical user manual. For background reading on the scientific concepts used we will refer to the online documentation.
Region specific user-defined settings
In this section we discuss all options that are user adjustable and can be specified for the region, resolution and period of interest. Options will be discussed following the order in the .ini file.
User specified DEM of area of interest
The user can specify his region of interest, and the desired regular grid resolution by providing a high resolution DEM covering the region of interest. The file should be provided in a GDAL supported rater format. The location and name of the file are given in the ini file:
[downscaling]
highResDEM=highResDEM\wflow_dem.map
radiationcordir=output_rad\
#radiationcordir=None
The DEM will be used for the definition of the extend and resolution of the generated meteorological output files. If the option ‘downscaling’ is turned on the altitudes in the DEM will be used to spatially downscale temperature, air pressure and radiation. IF the directory containing the radiation data is set to ‘None’ the radiation is not corrected according to aspect and slope but only for altitude.
User settings in the e2o_calculateEvaporation.ini file
Below a description of the content of the .ini file is given. Options can be turned on or off by:
- for multiple options: adding / deleting a hashtag in front fo the option
- for simple on or off: indication True (on) or False (off)
Server location
The server location refers to the online location where the eartH2Observe WRR datasets are hosted. At this stage there are two datasets available:
- the WRR1 dataset which is directly derived from the global WATCH-Forcing-Data-ERA-Interim dataset (Weedon et al.,
2014) that was developed as processor of the WATCH forcing dataset developed in the EU FP6 project EU-WATCH (Weedon et al., 2012). This dataset has a spatial resolution of 0.5 degrees and a 3-hourly temporal resolution. + the WRR2 dataset in which several improvements have been made compared to the WRR1 dataset.
This dataset has a spatial resolution of 0.25 degrees and a 3-hourly temporal resolution.
The serverroot for both datasets is:
serverroot = http://wci.earth2observe.eu/thredds/dodsC/
The wrrsetroot depends on the dataset a user prefers to use:
- For the WRR1 : wrrsetroot = ecmwf/met_forcing_v0/
- For the WRR2 : wrrsetroot = ecmwf/met_forcing_v1/
Note
At this stage the WRR2 dataset is largely untested.
Evaporation options
Three methods to calculate evaporation have been implemented in the down-scaling tool:
- Penman-Monteith : a physically based equation considering most relevant atmospheric processes
- Priestley-Taylor : a substitute of the Penman-Monteith equation where the aerodynamic term has been replaced by an
empirical multiplier
- Hargreaves : A simplified form of the Penman-Monteith equation using temperature and an annual radiation cycle as input
For more information on the implemented equations and a brief comparison we refer to Sperna Weiland et al. (2015).
The equation to be used can simply be selected by removing the hashtag in front of the specific method making sure the hashtag is present before all other methods. In the example below Penman-Monteith will be used.
# Choose one of the three methods below
evapMethod = PenmanMonteith
#evapMethod = Hargreaves
#evapMethod = PriestleyTaylor
Resampling and downscaling
- With the option resampling the user can select whether the data needs to be resampled to the resolution of the by the
- user provided DEM (see section 3.1).
If the option resampling is set to True a second optimization can be chosen with the downscaling option. If the downscaling option is set to True temperature and air pressure will be corrected based on the difference in altitude in the high-resolution user specified DEM and the low-resolution DEM that belongs to the WRR1 or WRR2 datasets.
These DEMs are located in the folder : /e2o_downscaling/e2o_dstools/data and are called DEM-WRR1.tif and DEM-WRR2.tif. The downscaling tool automatically selects the correct DEM based on the selected meteorological forcing (met_forcing_v0 or met_forcing_v1) defined in the .ini file at wrrsetroot. When both downscaling and resampling are set to false the maximum spatial extend required for the data to be read from the netCDFs file can be set by defining the corners of the area of interest: latmin, latmax, lonmin and lonmax.
If one is for example only interested in data for Australia the process can be accelerated by avoiding the reading of the full world maps from the netCDFs file by setting an extend slightly larger than the Australian continent.
# Specify bounding box to download from server. Should be a bit bigger that the DEM
latmin = -45
latmax = -4
lonmin = 110
lonmax = 155
Variable lapse rate
For the downscaling of temperature, air pressure and radiation from the WRR1 dataset only a constant lapse rate of -0 .006 degrees/m can be used. The WRR2 datasets contains monthly fields of spatially and temporal varying lapse rates
– derived from atmospheric conditions. To use these varying lapse rate fields for the downscaling the following option should be set to True:
[downscaling]
# useVarLapseRate = True -> use spatial and temporal varying lapse rate provided as part of the WRR2 forcing dataset
# in stead of the default value of -0.006
useVarLapseRate = True
Time period
The WRR1 and WRR2 datasets are available for the period 01-01-1979 to 31-12-2012. The user can specify the period of interest, see the example below for 1979:
# Start and end-year, month and day of the evaporation calculations
startyear = 1979
endyear= 1979
startmonth = 1
endmonth = 12
startday = 1
endday = 31
Radiation correction
The WRR1 and WRR2 provide potential solar radiation which is the radiation of an unobstructed or cloudless sky. The magnitude of this potential solar radiation that reaches the earth surface depends on the position of the sun the solar altitude or solar angle during the day, the inclination of the solar rays with the earth’s surface, the amount of radiation at the outer layer of the earth’s atmosphere, the transmissivity of the sky and the altitude of the earth’s surface.
With the high resolution DEM the potential solar radiation can be corrected for aspect and shading. The correction for cloudiness and other back scatter is derived from the transmissivity of the air and the path length radiation needs to travel before reaching the earth’s surface.
The coefficient for radiation correction are calculated in the radiation sub-routine are describe seperately. The directory where the correction files are located should be defined in the ini file:
[downscaling]
# Where to find the output of the e2o_radiation script
radcordir=output_rad
Below you will find the filenames and their content:
COR00000.??? - Total clear sky radiation on DEM
SUN00000.??? - Nr of time intervals a pixel was in the sun
FLAT0000.??? - Total clear sky radiation on a flat surface
CORDIR00.??? - Direct clear sky radiation on DEM
FLATDIR0.??? - Direct clear sky radiation on a flat surface
For full details see the radiation section.
Output
The user can specify the format of the output files – any of the gdal formats can be selected. These can, together with their shortnames, be found at: http://www.gdal.org/formats_list.html
[output]
# Gdal output format string
# See: http://www.gdal.org/formats_list.html
# examples: AAIGrid, PCRaster, GTiff etc
format=     GTiff
The user can indicate the output location where all files should be stored:
directory=output/
The first letters of the evaporation output files are set with the prefix:
prefix=PET
If all other meteorological variables need to be saved the “saveall” option should be set to true.
# If saveall is true all variables used are saved instead of only the PET
saveall=1
Example e2o_calculateEvaporation ini file:
[url]
# Server location and location of the WRR forcing
serverroot = http://wci.earth2observe.eu/thredds/dodsC/
wrrsetroot = ecmwf/met_forcing_v1/

[selection]
# What to do
calculateEvap = True
# Choose one of the three methods below
evapMethod = PenmanMonteith
#evapMethod = Hargreaves
#evapMethod = PriestleyTaylor

# Specify box to download from server. Should be a bit bigger that the DEM
latmin = -90
latmax = +90
lonmin = -180
lonmax = 180

# Start and end-year, month and day of the evaporation calculations
startyear = 1979
endyear= 1979
startmonth = 1
endmonth = 12
startday = 1
endday = 31

[downscaling]
# location of original DEM (WFDEI) and the local high resolution DEM
highResDEM=highresdem\DEM.tif
# Resampling = True -> resample to resolution of dEM specified in downscaling section
# Downscaling = True -> also apply DEM based correctiosn of T, Radiation, Pressure
resampling  = True
downscaling = True
# useVarLapseRate = True -> use spatial and temporal varying lapse rate provided as part of the WRR2
# forcing dataset in stead of the default value of -0.006
useVarLapseRate = True
# Where to find the output of the e2o_radiation script
radcordir=output_rad

[output]
# Gdal output format string
# See: http://www.gdal.org/formats_list.html
# examples: AAIGrid, PCRaster, GTiff etc
format=     GTiff
directory=output/
prefix=PET
# Is saveall is true all variables used are saved instead of only the PET
saveall=1
Downscaling Precipitation
The e2o_getvar script can downscale precipitation (Rainfall) using the WorldClim dataset which supplies monthly climatology. It does so using the following steps:
- The WorldClim data is averaged to the resolution of the original data (0.25 degree)
- For each timesteps a factor is determined for each pixel by dividing the WordClim data for the corresponding month by the current data.
- This factor is rescaled to the desired output resolution
- The WorldClim data at the desired output resolution is divided by the derived factor to obtain downscaled input data
If we assume the input precipitation data is the avegare for the 0.25 grid cell it is best to use the nearest interpolation. The efects of downscaling and interpoltion types is shown in the figure below.
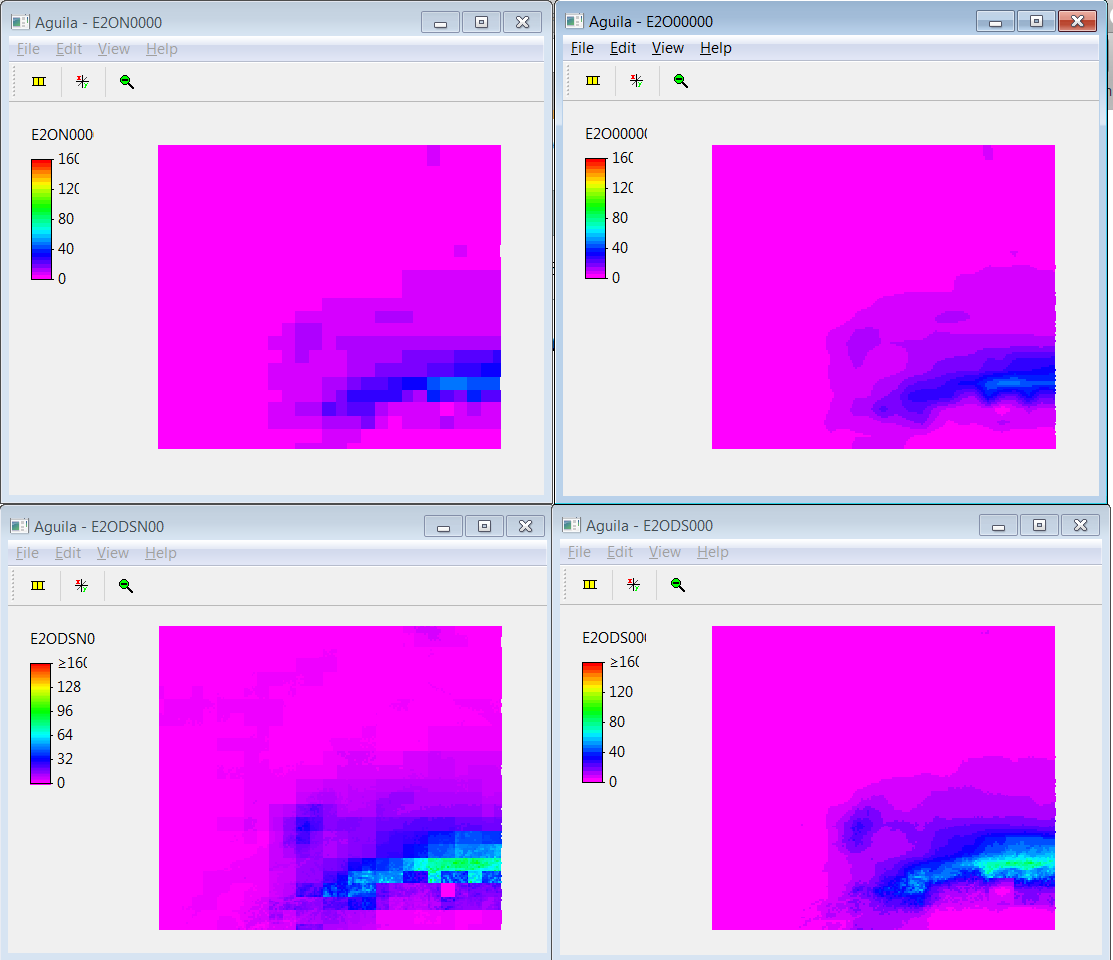
Precipitation for the earth2observe MSWEP dataset for the Rhine basin. Top left is the original data interpolated using a nearest interpolation. Top right the original data but interpolated linear. Bottom left is downscaled using the WorldClim data using a nearest interpolation while the bottom right is downscaled using WorldClim and a linear interpolation.
Running the examples
The example directory currently has two examples:
- getvar - example for the e2o_getvar scripts
- evaporation - example fro the e2o_calculateEvaporation script
getvar
The getvar directory contains the following files:
- run_example.bat - windows batch file to run one of the examples
- examplerun1.ini - configuration file for e2o_getvar to download and interpolate MSWEP Precipitation (from WRR2)
- examplerun2.ini - configuration file for e2o_getvar to download and Downscale MSWEP Precipitation. You will need to have downloaded the WorldClim precipitation data to use this example (https://github.com/earth2observe/downscaling-tools/releases/tag/2016-data-prec).
- examplerun3.ini - As 2 but with linear interpolation (instead of nearest)
- examplerun4.ini - As 3 but the output is saved in a netcdf file
- examplerun5.ini - As 2 but for Snowfall instead of Rainfall
- examplerun6.ini - Configuration file for e2o_getvar to download and Downscale WFDEI Precipitation (from WRR1).
- examplerun7.ini - downscale WFDEI temperature (and convert to Celcius)
- README.txt - Some information on the example
- wflow_dem.map - local scale digital elevation model
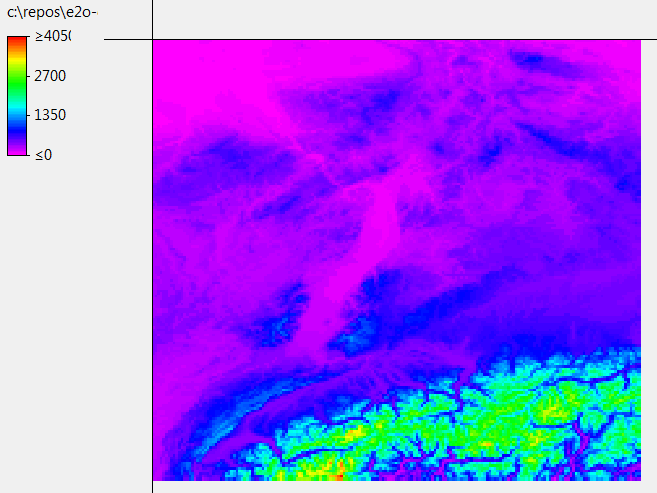
The local elevation model (wflow_dem.map) used for downscaling.
The contents of the examplerun7.ini file is shown below. This contains all the settings for the e2o_getvar script. For example, by changing the line “interpolmethod=linear” to “interpolmethod=nearest” the script will uses a different interpolation method. Here the local elevation model (wflow_dem.map) is also specified. The map can be in any GDAL supported raster format. The grid should be defined in lat,lon. Optionally you can save the results in a netCDF4 file by specifying the netcdfout option in the output section. In that case you can also specify attributes to save in the netcdf file, see examplerun7.ini.
# This example downloads and resamples the MSWEP precipitation data
# MSWEP is the precipitation/snwofall forcing of WRR2
# The file is setup to retrieve a full year of data


# example 7: downscale WFDEI temperature (and convert to Celcius)


[url]
# WRR0 (WFDEI)
serverroot = http://wci.earth2observe.eu/thredds/dodsC/
wrrsetroot = ecmwf/met_forcing_v0/

# WRR1 (EI with corrections)
#serverroot = http://wci.earth2observe.eu/thredds/dodsC/
#wrrsetroot = jrc/MSWEP/daily_e2o_netcdf_convention/


[selection]
startyear = 1979
endyear= 1979
startmonth = 1
endmonth = 12
startday = 1
endday = 31
wrrversion=1

resampling=True
# Set the variable to use here, see the table in the documentation for names
variable=Temperature
filename=Tair_daily_E2OBS_
standard_name=air_temperature


#Table: Variables and names to be used in the ini file

#==================================== ====================== ==================== =========================================
#Variable                             Filenames WRR2         Filenames WRR1       standard_name
#==================================== ====================== ==================== =========================================
#Temperature                          Tair_daily_EI_025_     Tair_daily_E2OBS_    air_temperature
#DownwellingLongWaveRadiation         LWdown_daily_EI_025_   LWdown_daily_E2OBS_  surface_downwelling_longwave_flux_in_air
#SurfaceAtmosphericPressure           PSurf_daily_EI_025_    PSurf_daily_E2OBS_   surface_air_pressure
#NearSurfaceSpecificHumidity          Qair_daily_EI_025_     Qair_daily_E2OBS_    specific_humidity
#Rainfall                             Rainf_daily_MSWEP_025_ Rainf_daily_E2OBS_   rainfall_flux
#SurfaceIncidentShortwaveRadiation    SWdown_daily_EI_025_   SWdown_daily_E2OBS_  surface_downwelling_shortwave_flux_in_air
#SnowfallRate                         Snowf_daily_MSWEP_025_ Snowf_daily_E2OBS_   snowfall_flux
#NearSurfaceWindSpeed                 Wind_daily_EI_025_     Wind_daily_E2OBS_    wind_speed
#LapseRate                            lapseM_EI_025_                 -            air_temperature_lapse_rate
#==================================== ====================== ==================== =========================================


# Optional conversions
[conversion]
# to celcius
Temperature= Temperature - 273.15
# To mm
Rainfall= Rainfall * 86400
TotalPrecipitation = TotalPrecipitation * 86400


[downscaling]
highResDEM=wflow_dem.map
downscaling=True

# linear, nearest
interpolmethod=linear


[output]
# Gdal output format string
# See: http://www.gdal.org/formats_list.html
# examples: AAIGrid, PCRaster, GTiff
format=GTiff
directory=output/
prefix=TEMP
As can be seen from the file (the conversions section) two unit conversions have been setup: Temperature is converted to degree Celsius and rainfall is converted to mm.
To run the example type run_example.bat in a windows command box. You should see output similar to the screenshot below:
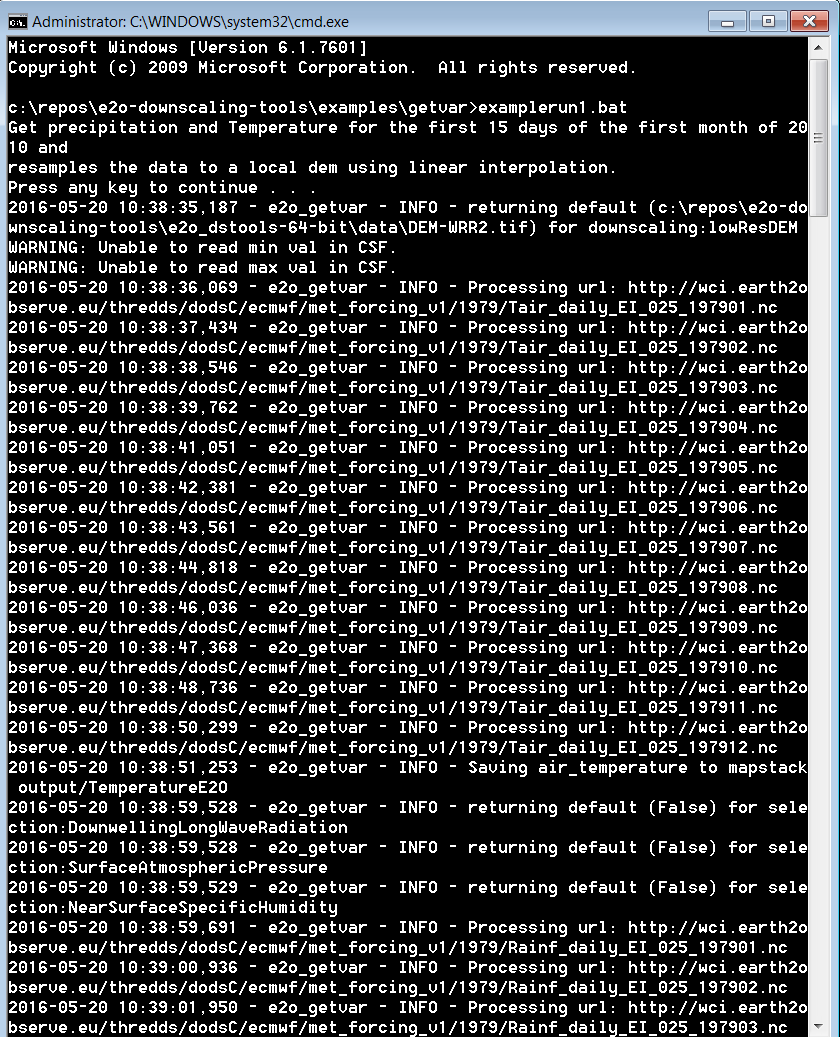
Running the run_example.bat file.
The results are stored in the directory:
- outputTemperature
The directory contains one file for each time number 001 to the last step (365):
TEMP0000.001
TEMP0000.002
TEMP0000.003
TEMP0000.004
....
TEMP0000.365
The files can be opened in most GIS programs or in the PCRaster aguila program.
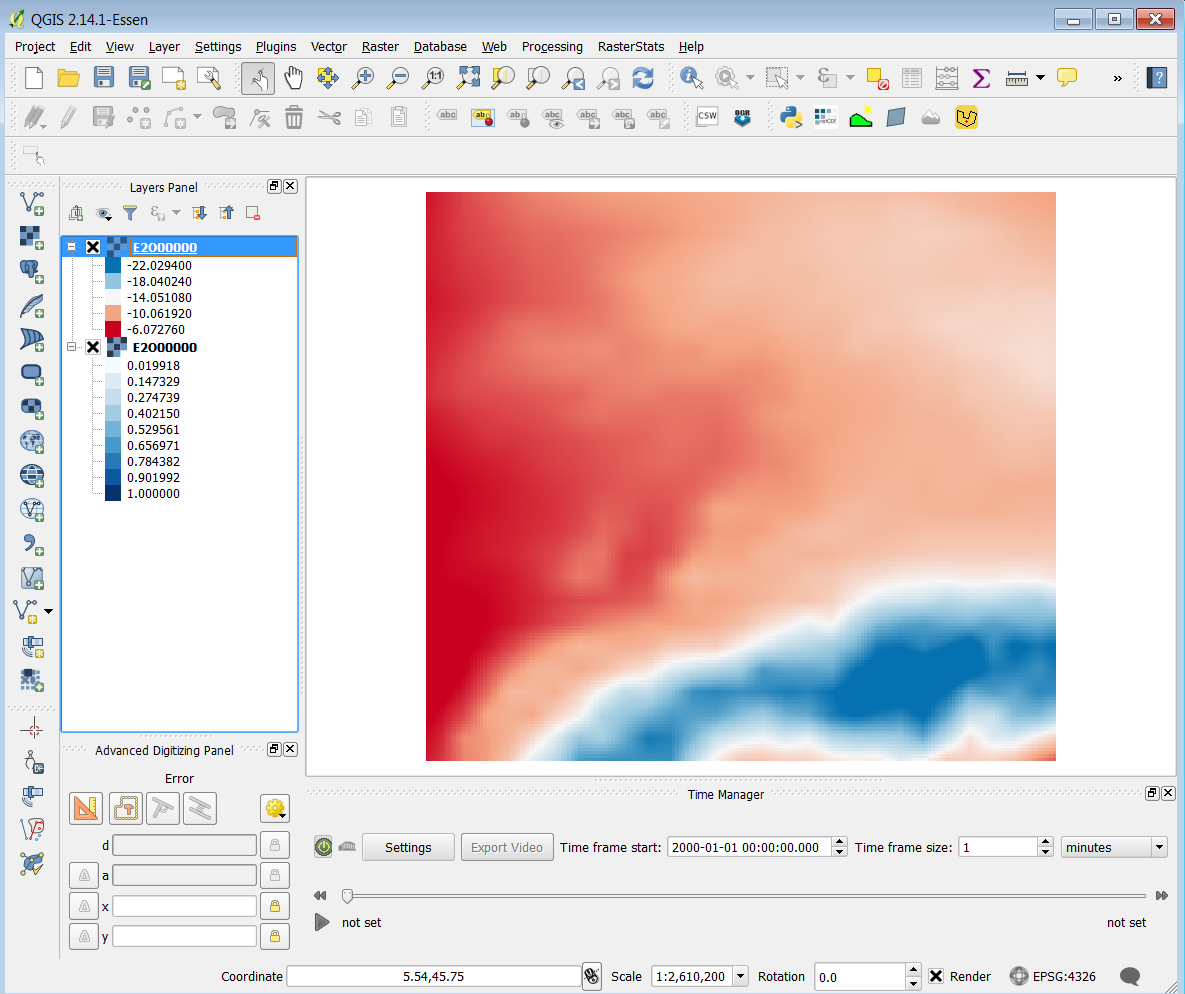
Display results of one timestep in QGIS.
If you set the output format in the ini file to PCRaster the resulting files can be used directly in the wflow hydrological models (https://github.com/openstreams/wflow).